


Introduction
Every e-commerce owner knows this feeling. Ads are working, website traffic is growing, the number of orders looks promising. Yet, when it comes time for the financial summary, it turns out that the profit is far from expectations. The margin shrinks under the weight of marketing costs, returns, and inefficient logistics.
Is it possible to sell more without falling into the trap of rising costs? The answer is yes – the key is proper e-commerce analytics, which allows for optimizing marketing activities and managing the costs associated with running an online store. Thanks to it, you can increase sales efficiency, better understand customer needs, and effectively personalize offers, which translates into higher revenues without the need to lower the gross margin. Personalizing the offer based on data analysis enables better responses to customer needs, which is crucial for an effective e-commerce strategy.
Introducing modern analytical tools and integrating data from various sales channels enables tracking key indicators such as conversion rate, customer acquisition cost, or average cart value. This allows for making more accurate decisions that increase online sales while controlling costs related to marketing and returns handling. Drawing conclusions from analyzed data is essential for optimizing actions and effectively responding to changing customer needs.
In the following sections of the article, we will present how, through data analysis and the use of advanced technologies, you can improve sales process efficiency, predict market trends, and build long-term customer loyalty. Advanced technologies enable more sophisticated data analysis and offer personalization, which leads to better alignment with customer needs and achieving success in e-commerce.

Challenges in decision-making in e-commerce
Data Silos and Various Reporting Forms
Recall the moment when you tried to compare the results of an advertising campaign with sales data. Data from Meta Ads do not match Google Analytics, Shopify shows something else, and you don’t know where the truth lies. Each data source has its own reporting methods, leading to inconsistencies.
Daily data compilation and report creation is the reality of every marketer and analyst – yet this is a time-consuming task that could be better used for real business development.
The problem of data silos affects both growing and established online stores. As a result, companies manually export raw data from various analytical systems to CSV files and then combine them in Excel or Google Sheets – which is not only time-consuming but also error-prone and difficult to scale. Working with raw data from different sources introduces challenges in maintaining data quality, as inconsistencies, duplicates, or errors can easily occur, impacting the accuracy of reporting and decision-making. An additional challenge is integration with other systems such as advertising platforms, e-commerce platforms, or marketing automation tools, which makes obtaining a complete picture of operations difficult.
In such cases, advanced technologies play a key role by eliminating data silos through automatic integration and centralization of information from various sources.
Concerns About Data Integration
Many e-commerce owners know their systems require integration but fear that transferring data to modern tools will be costly and complicated. We often hear: “I can just do it all in Excel.” Yes, but only until the business scale gets out of control. Integration with other systems, such as e-commerce platforms, advertising systems, or analytical tools, is a key step to obtaining full and consistent e-commerce analytics. It is crucial to efficiently load data into centralized platforms, such as data warehouses, to enable comprehensive analytics, reporting, and visualization for better business insights.
Then chaos, analysis errors, and inefficient marketing budget management appear. Lack of integration is a problem that in the long run leads to greater losses than the initial cost of implementing modern tools. Using advanced technologies such as Headless, PWA, PIM, ERP, or artificial intelligence eliminates these problems and ensures process stability, especially when experienced data professionals are involved to ensure successful integration and ongoing data management.
Excel analytics makes sense at a small scale – when operating on hundreds of orders monthly, manual work may suffice. However, as the company grows and the number of new customers increases, manual processes become increasingly time-consuming and error-prone. System integration is essential for further company development and enables efficient scaling of operations.
Moreover, later system integration when the company reaches a large scale can be significantly more expensive and time-consuming. Meanwhile, more technologically agile companies can surpass us by optimizing their activities faster and more effectively. Thanks to data integration, it is also possible to better understand customer needs and more effectively tailor the offer to their expectations.
Lack of Visibility of Actual Margin and Long-Term Effectiveness
Imagine investing in an advertising campaign that at first glance looks profitable – it generates high revenues. However, after a few months, it turns out that most orders came from customers who quickly returned products or bought products with minimal margin. To properly assess profitability, one must analyze net margin and operating costs allocated to each sale, which allows understanding the real profit from each transaction. Statistical analysis is essential for evaluating net margin and the long-term effectiveness of campaigns, helping to identify trends and optimize future strategies.
Companies that do not consider actual costs often lose money even if their sales grow. Interpreting data related to sales, returns, and margins is necessary to make informed decisions and avoid costly mistakes.
Without full analysis of margin, return costs, and long-term customer lifetime value (LTV), as well as analysis of results within a given period, marketing decisions may lead to situations where the most profitable campaigns actually generate losses.
Wrong decisions in this area can result in loss of profits and deterioration of the company’s financial condition. Therefore, full margin analysis, including net margin and all operating costs, is crucial for the profitability of an online store.
How to solve corporate data problems in e-commerce?
Entrepreneurs often think that to improve e-commerce analytics and optimize sales, they must undertake costly technological transformations. Meanwhile, the key lies not in reinventing the wheel but in smarter use of data the company already possesses, leveraging proven strategies for data organization and integration. Proper organization and integration of this information, as well as applying data analyses and drawing conclusions from the obtained results, along with analyzing data to inform business decisions, are enough to get a fuller business picture and make more accurate decisions.
Centralizing data in a Data Warehouse
Integrating sources into a single data warehouse (e.g., Google BigQuery) helps avoid problems related to silos. This includes integration with other systems such as e-commerce platforms, ERP systems, or analytical tools, as well as with advertising platforms like Google Ads, Facebook Ads, or other PPC and social media platforms. Centralizing product data ensures consistency in product descriptions, pricing, and availability across all platforms, which is crucial for a seamless shopping experience and maintaining data integrity. It also supports effective inventory management by enabling better inventory tracking, demand forecasting, and supply chain efficiency. Thanks to this, all key information (campaign costs, sales, returns, margins) is available in one place, in real-time. Advanced technologies such as Headless, PWA, or PIM additionally support centralization and effective data management.
Consistent analytical system for decision-making and marketing optimization
With appropriate technology, it is possible to combine data from various platforms and integrate it with other systems and advertising platforms, creating a unified picture of the situation. For example, if GA4 shows different results than Meta Ads, a reconciliation model can be applied that considers actual conversion paths by combining information from both places. Building a consistent analytical system requires using advanced technologies such as Headless, PWA, or AI, which enable effective data integration and analysis. Data visualization tools, such as charts and dashboards, play a crucial role in e-commerce analytics by making complex data more understandable and actionable for decision-makers.
Reporting Automation and Margin Tracking
Using Business Intelligence tools such as Looker Studio, Power BI, or Tableau allows automating reporting and saving dozens of hours of work monthly. Decision-makers have access to up-to-date data without involving analysts.
To more easily monitor actual margin on products and sales channels, it is worth using the E-commerce Margin Calculator. See how simply you can analyze profitability in your e-commerce, considering net margin and operating costs for each sale.
Automatic reports can include not only revenues but also net margin, allowing optimization of marketing expenses. Tracking transaction data and conversion rates in real-time helps identify trends, detect performance issues, and optimize e-commerce strategies for better results. If a channel generates high revenues but low margin, it can be adjusted or replaced with a more profitable one. Additionally, reports can include sales price calculations, which directly impact store profitability through appropriate markup settings.
Long-term effectiveness predictions – strategy for years
Machine learning models can predict customers’ LTV, allowing optimization of campaigns not only for short-term conversion but also for long-term profitability. By analyzing purchase patterns, order frequency, and traffic sources, it is possible to identify customers with the highest value potential and focus marketing efforts on them. Predictive analytics can also forecast customer demand, helping to inform inventory planning and ensure optimal stock levels.
Advanced algorithms help determine which acquisition channels generate users with the highest LTV, enabling precise allocation of advertising budgets. Personalization of the offer is a key aspect of an effective strategy because it allows better matching of messages and products to audience expectations. Advanced analytics can identify customer segments, enabling more targeted marketing and personalized campaigns. For example, if predictive analysis shows that customers acquired through email marketing campaigns have higher long-term value than those from display ads, the pricing strategy can be adjusted by directing more resources to more effective sales channels and by using analytics to develop effective pricing strategies based on customer value.
Furthermore, forecasts allow better customer relationship management through offer and communication personalization. Machine learning models can indicate the moment when a customer is likely to make the next purchase, allowing sending a tailored offer at the optimal time, increasing conversion probability and building long-term loyalty. Adapting actions to customer needs and individualizing communication accordingly makes the brand respond more effectively to audience expectations. Such an approach enables success in e-commerce.
Conversion Optimization Through Data Analysis
Conversion optimization is a key element of effective online sales in e-commerce. Thanks to advanced data analysis, online store owners can precisely identify barriers that prevent customers from completing purchases. Optimizing the ecommerce site to better engage online shoppers—through strategies like seasonal campaigns and a streamlined checkout process—directly drives more sales. Analyzing which products are most popular, how much time users spend on product pages, and the cart abandonment rate allows quickly spotting weak points in the purchase process.
This data enables implementing specific changes – from improving product descriptions, simplifying the purchase path, to optimizing product pages for mobile devices. As a result, the conversion rate grows, and the online store generates higher online sales without increasing the advertising budget.
Moreover, data analysis enables predicting trends in customer behavior, allowing faster response to changing market needs. Thanks to this, it is possible not only to increase sales efficiency but also to build a competitive advantage in the dynamic commerce world.
Data-driven marketing strategies
Modern e-commerce cannot function without data-driven marketing strategies. Data analysis allows not only better understanding customer needs but also precisely determining which sales channels bring the best results and how gross margin shapes on individual products.
By monitoring customer acquisition cost and the effectiveness of individual advertising campaigns, online stores can optimize marketing activities, investing budgets where they bring the highest return. This includes using targeted marketing campaigns and email marketing tools to reach the right target audience with personalized messages.
Data analysis also enables identifying potential customers who have the greatest chance of making a purchase or benefiting from loyalty programs, as well as leveraging paid ads and analyzing customer preferences to personalize offers and improve campaign effectiveness.
In practice, this means that every marketing dollar is better utilized, and online sales grow without the need to lower sales prices or give up gross margin. Data-driven marketing strategies are the key to building lasting customer relationships, increasing their loyalty, and achieving success in the e-commerce industry.

Case Study: Support that increased client profits
Client Problem
Our client, a dynamically developing e-commerce store selling accessories for phones and other mobile devices, faced a serious challenge related to effective data management. Lack of integration between key systems – GA4, Meta Ads, and ERP – meant the operations team spent hours manually processing data. A similar challenge was described in the Angry Kraken case study on improving resource allocation in User Acquisition.
Daily exporting reports to Excel, where data from various sources were merged and analyzed, was a tedious process prone to errors and causing delays in decision-making. Assortment analysis did not include detailed data about each product, such as its features or identifier, nor did it allow assessment of sales results of a given product in a given period, which hindered identifying trends and seasonality. The absence of customer demographics data further limited the ability to segment and target customers effectively.
Moreover, analysis was mainly based on revenues without deep insight into the actual margin of individual products and categories, resulting in misguided marketing decisions and errors in advertising budget allocation. Also missing was analysis of the moment when customers added products to the cart, preventing assessment of the impact of this stage on cart abandonment rate and implementation of measures to reduce dropouts. For a long time, advertising campaigns were run for products with the highest return rates! Additionally, it was not analyzed which customer contact channel was most effective in the service process, limiting personalization possibilities and missing the opportunity to track customer interactions that are crucial for improving personalization and service.
Solution implemented by Alterdata
Building a data warehouse (Google BigQuery) – we implemented a central system that combined data from GA4, Meta Ads, and ERP into one coherent data warehouse. The warehouse was integrated with other systems, including e-commerce platforms and advertising platforms, consolidating data from the ecommerce store to enable comprehensive analytics. Thanks to this, the team gained access to standardized, current information in real-time, eliminating the need for manual data processing.
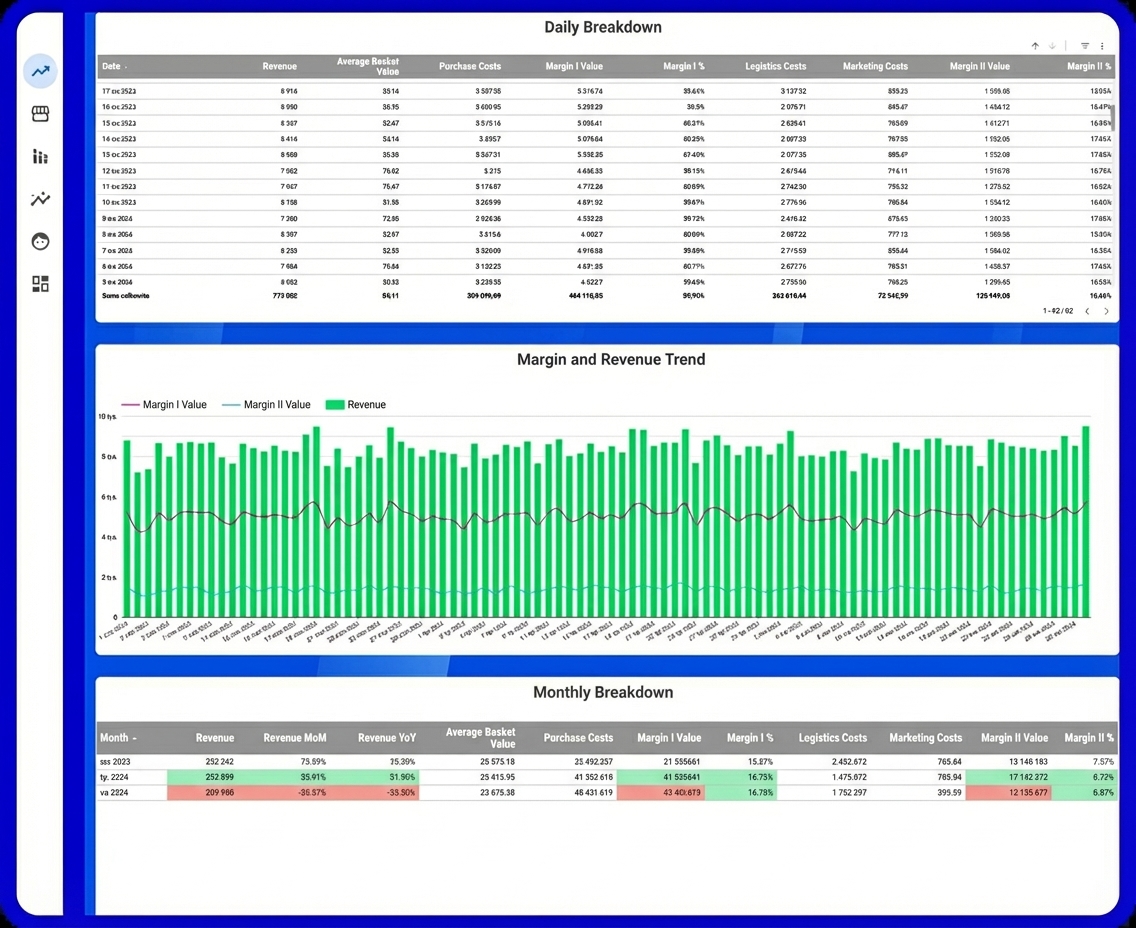
Automatic dashboards in Looker Studio – we designed interactive dashboards that allow tracking key indicators such as conversion cost, campaign profitability, and product margin. The project used advanced technologies such as Headless, PWA, and integrations with PIM and ERP to ensure flexibility and scalability of analytical solutions.
Reports are generated automatically, allowing the team to focus on analysis and optimization instead of wasting time on manual reporting.
User LTV prediction – we implemented machine learning models analyzing customer data, their behaviors, and purchase history. This made it possible to predict long-term customer value and segment groups with the highest profit potential. Based on data analysis, offer personalization was implemented, allowing better matching of communication and products to individual customer needs. Additionally, analyzing customer feedback enabled further refinement of communication strategies and product offerings.
This allowed precise adjustment of marketing strategy and budget allocation to the most effective sales channels.
Cooperation Effects
- The marketing team spends one day less per month on manual reporting. A key aspect of this effect was understanding customer needs and adapting reporting processes to their expectations, which also helped build loyal customers through more targeted and effective communication.
- Real profit (after accounting for campaign costs and margin) increased by 10%. This growth contributed to company development and allowed achieving success thanks to implemented analytical solutions. Additionally, the solutions helped reduce operating costs by streamlining processes and improving overall efficiency.
Summary
Sales growth in e-commerce without reducing margins is possible thanks to effective data management. Data centralization, reporting automation, and precise margin tracking allow not only making more accurate business decisions, increasing sales efficiency, and optimizing costs related to marketing and returns handling, but also drawing conclusions from analyzed data.
Besides margin monitoring, in e-commerce analytics, key indicators worth tracking include conversion, average order value, and customer retention. Their analysis helps better understand marketing effectiveness, user segmentation, and sales funnel efficiency.
E-commerce analytics is crucial for achieving success and sustainable company growth, enabling entrepreneurs to outpace competition and effectively scale their business.
And if you want to see how data can truly increase the profitability of your e-commerce, build a complete margin overview, and enable fact-based decision making, get in touch with us. We will help you create a modern data ecosystem that works to grow your business.